Chart Setup for Trading: How to Arrange a Six-Chart Screen for NSE Stocks
Updated · BreakPoint Research Desk
A good chart setup gives every chart on your screen one job. Put the market on one chart (Nifty 50), the stock’s sector on another, and a higher timeframe of your main stock on a third. Use the remaining charts for the stocks you might actually trade, on the timeframe you trade them on.
Keep indicators to two or three that you actually act on. Set them up once and copy them to every chart. Then keep your list of candidates beside the charts, so moving a stock from the list to a chart is one click and not a copy-paste.
Key takeaways
- Every chart needs a job. If you cannot say what a chart is for, close it.
- Top row for context (index, sector, higher timeframe), bottom row for trades.
- Watch the stock on the timeframe you trade, and check one timeframe higher for the level that matters.
- Two or three indicators you act on are better than eight you only look at.
- Four charts you actually watch beat six you only glance at. Use extra charts for context, not extra trades.
What should a trading chart setup do?
Before any trade you need four answers. A good screen shows all four without switching tabs.
| Question | Chart that answers it | Why it matters |
|---|---|---|
| Is the market with me? | Nifty 50 on your trading timeframe | Most stocks move partly with the index. Longs against a falling Nifty need a stronger reason. |
| Is the stock’s group moving? | The sector index (Nifty Bank, IT, Metal…) | A stock moving with its whole sector usually follows through better than a lone mover. |
| Where is the bigger level? | The same stock, one timeframe higher | A 5-minute breakout that runs straight into a daily high has very little room. |
| Is my trigger here yet? | The stock on the timeframe you trade | Your entry, stop-loss and target come from this chart only. |
That is why this tutorial uses six charts: three answer the first three questions, and three hold the stocks you might trade. Here is what that looks like on a real screen, BreakPoint’s chart page with six live charts and a list panel beside them.
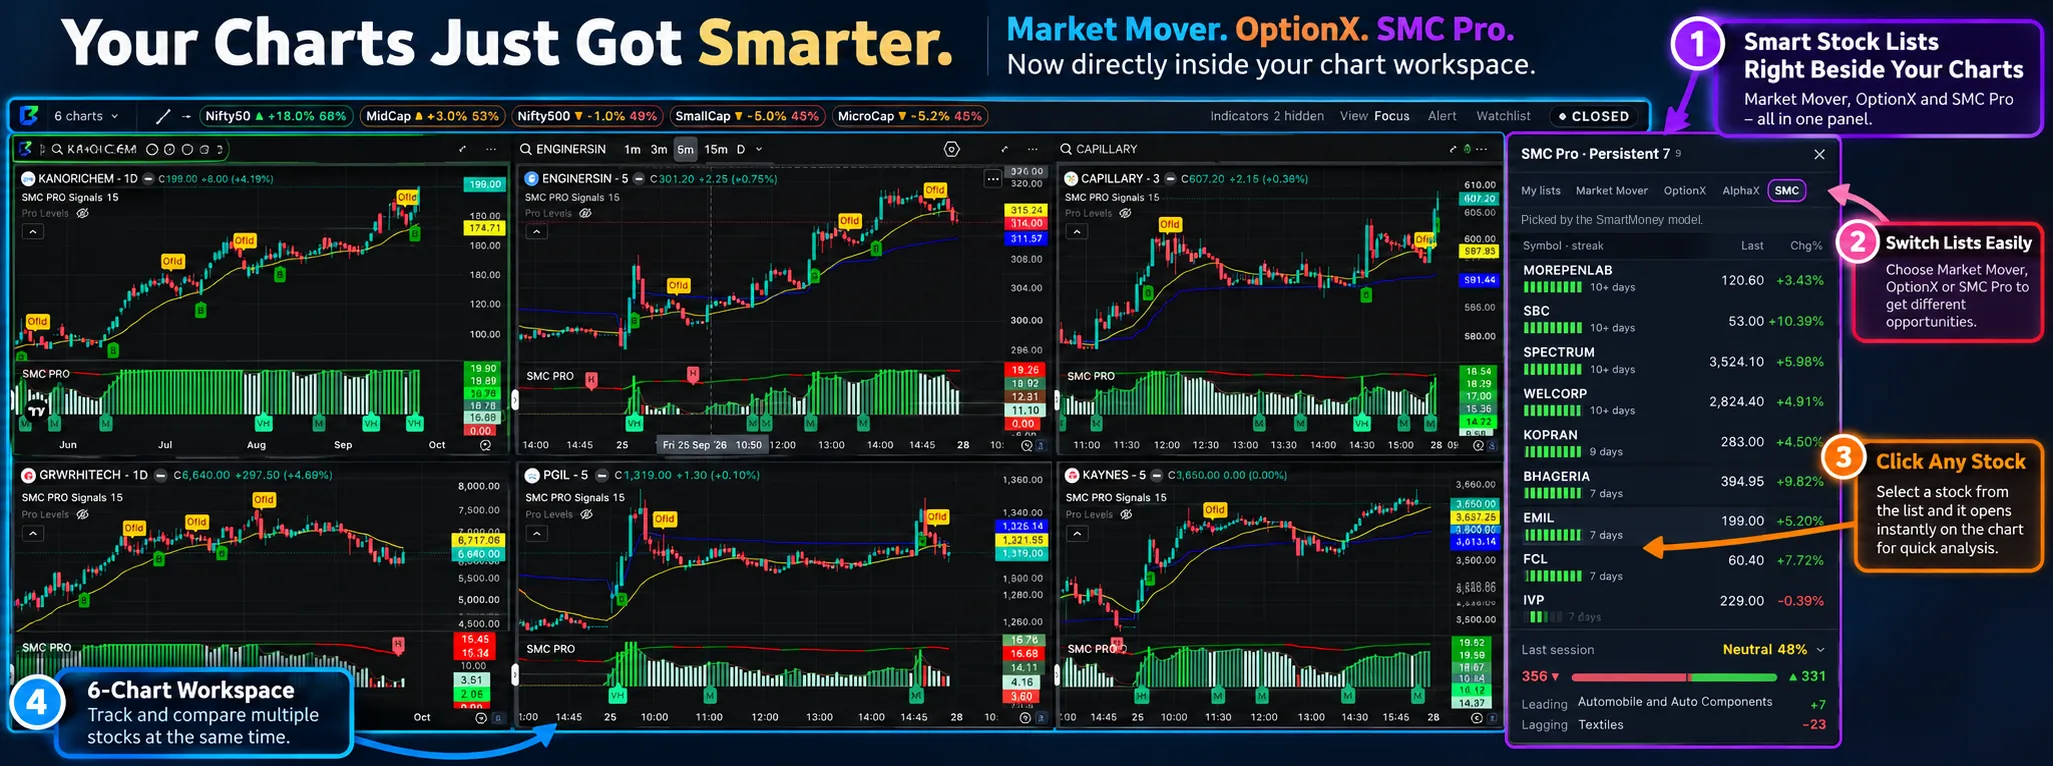
- Lists beside the chartsMarket Mover, OptionX and SMC Pro lists sit in one panel next to the grid, alongside your own watchlists.
- Switch listsTabs along the top of the panel move between lists without leaving the chart page.
- Click a stockThe stock opens on the active chart, the one with the green outline.
- Six charts at onceEach chart keeps its own stock and timeframe, so you can compare several stocks or one stock on two timeframes.
How to arrange six charts: context on top, trades below
The layout matters less than the rule behind it: your eyes should always know where to look for context and where to look for the trade.
Chart 1: Nifty 50
On the same timeframe you trade. This is the chart you read first every time you look up. If you trade Bank Nifty stocks, use Nifty Bank here instead.
Chart 2: the sector index
The index for the group your main stock belongs to. Change it when your main idea changes sector.
Chart 3: your main stock, one timeframe higher
Daily for an intraday trader, weekly for a swing trader. Mark the nearest big high and low here. These are the levels a small-timeframe move is likely to run into.
Charts 4 to 6: the stocks you might trade
Your second and third ideas, then your main stock on the trading timeframe in the last chart, directly under its daily chart, so the level and the trigger sit one above the other. Three is enough. If a fourth idea appears, it has to replace one of them.
On a laptop, use four charts: Nifty, the main stock one timeframe higher, and two trade charts. Put the sector index on a single tab and check it when your main stock moves.
Which timeframes to use on each chart
Trade on one timeframe and check one timeframe higher. Reading more than two timeframes at once usually just gives you more reasons to hesitate.
| Trading style | Trade on | Check one step higher | Index chart on |
|---|---|---|---|
| Intraday (scalps and quick trades) | 3 or 5 minute | 15 minute or daily | 5 minute |
| Intraday (trend trades) | 5 or 15 minute | Daily | 15 minute |
| Swing (a few days to weeks) | Daily | Weekly | Daily |
| Positional (weeks to months) | Weekly | Monthly | Weekly |
The higher timeframe is for levels and direction, not for entries. If the daily trend is up and the 5-minute chart gives a clean trigger, the trade has the wind behind it. If the 5-minute trigger is right under a daily high, either wait for that high to break or accept a smaller target.
Which indicators to keep on your charts
Every indicator should answer a question you actually ask before a trade. If you would not change a decision because of it, remove it.
| Indicator | The question it answers | Good for |
|---|---|---|
| EMA 20 (and 50 on the higher timeframe) | Which way is the short-term trend, and where is the first pullback area? | Every style |
| VWAP | Is the average buyer today in profit or at a loss? | Intraday only; it resets every day |
| Volume | Did many participants take part in this move, or only a few? | Breakouts and breakdowns |
| Previous day high, low and close | Where are the levels everyone can see? | Intraday |
| RSI | Is momentum fading while price still pushes? | Swing, and spotting tired moves |
Pick two or three from this list, not all five. On a six-chart screen, each extra indicator costs space on every chart. Set them up once on the first chart and copy them to the others, so every chart reads the same way and you are not comparing different settings by mistake.
Adding indicators after a loss feels like fixing something. Usually the loss came from the entry, the stop or the size, not from a missing indicator. Review those first.
Step by step: setting up six charts on BreakPoint
BreakPoint’s chart page, at brkpoint.in/chart, is built on TradingView’s charting library, so the drawing tools, timeframes and shortcuts work the way TradingView users expect. It adds Indian-market lists and context around the charts. The whole setup takes about five minutes the first time.
1. Open the chart page and choose 6 charts
Open /chart and pick “6 charts” from the layout dropdown at the left of the top bar. Each chart gets its own stock and timeframe. The grid needs a browser window at least 1,000 pixels wide.
2. Read the top bar before any chart
The top bar shows whether NSE is pre-market, live or closed, and a row of index capsules (Nifty 50, Nifty 500, midcap, smallcap, microcap) with each index’s move and how many of its stocks are up. If midcaps are red while Nifty 50 is green, the rally is narrow.
3. Set up chart 1 with your indicators
Add your two or three indicators to chart 1. The other charts copy them automatically, so you set up one chart instead of six.
4. Fill the top row with context
Click chart 1 and type Nifty 50. Click chart 2 and load the sector index. Click chart 3 and load your main stock, then switch that chart to the daily timeframe.
5. Fill the bottom row from a list
Open the list panel and choose a list: Market Mover for the day’s movers, OptionX for F&O stocks on the move, AlphaX for your ideas with their levels, SMC Pro for the SMC Pro list, or your own watchlist. Click a chart to make it active (green outline), then click a stock in the list to load it there.
6. Mark levels and set alerts
Keep up to five favourite drawing tools in the top bar. Mark the daily high and low from chart 3 on your trade charts. Right-click at a price to set an alert there, so you do not have to stare at six charts all session.
7. Expand before you decide
When one chart starts to move, expand it to full size, read it properly, then press Esc to go back to the grid. Small charts are for watching; decisions are made on a full-size chart.
✅ Before the session starts
- Every chart has a job you can say in five words.
- The index and sector charts are on your trading timeframe.
- The main stock has a higher-timeframe chart with its big high and low marked.
- No more than three stocks on trade charts.
- Alerts are set at your trigger levels.
- Your stop-loss level is marked on the chart before you place the order with your broker.
Where to chart Indian stocks: BreakPoint, StockEdge or Chartink?
All three are popular with Indian traders, and they are built for different jobs. This table describes what each is built around. It is not a feature audit, because other platforms change their features often, so confirm the details on each provider’s site.
| What you need | BreakPoint | StockEdge | Chartink |
|---|---|---|---|
| What it is built around | Live scanners and analytics for active traders, with built-in charts | Mobile-first market analytics and learning | Custom technical screens that you write |
| Charting | TradingView-powered charts, up to six live charts in one window | Built-in charts inside the app | Screening is the focus; charts support the scan results |
| Where stock ideas come from | Prepared live lists (Market Mover, OptionX, AlphaX, SMC Pro) beside the charts | Prepared scans and data views | The scan conditions you build |
| Indian market context on the chart page | Index capsules, market breadth, leading and lagging industry, NSE status | Market data sections in the app | Not its focus |
| Where it is the stronger choice | A desktop screen where the list, the charts and the market context sit together | Doing most of your market work on a phone, and structured learning | Writing and sharing your own precise scan conditions |
Many traders use more than one: a screen builder for their own conditions, a phone app on the move, and one desk where the charts live. The full comparison, including Trendlyne, MoneyControl and ET Money, is on BreakPoint’s stock scanner comparison page, linked below.
Worked example: a first hour with six charts
Hypothetical session: a strong open, led by metals
Hypothetical example. Nifty 50 opens slightly up. In the top bar, midcaps are green with most of their stocks up and microcaps are red. The metal index is the strongest sector. Your main idea is a metal stock that closed near its high yesterday. (All names and numbers are illustrative.)
How to read it
The daily chart of your main stock shows its prior high about 1% above the current price. On the 5-minute chart it is trending up above its EMA 20. You mark the daily high on the 5-minute chart and set an alert just above it. Charts 4 and 5 hold two other metal stocks from the Market Mover list; chart 6 holds your main stock on 5-minute, right under its daily chart. At 10:05 the Nifty chart slips below its opening range while the metal index holds. Your main stock reaches the daily high, stalls, and pulls back. The alert never fires.
The six charts did not find a trade. They stopped a bad one: the 5-minute chart alone looked like a breakout, and the daily chart showed it was running into a wall. No trade was a correct result.
Common mistakes traders make
Six charts with six random stocks
Six trade charts means you watch none of them properly. Give at least two charts to context: the index and a higher timeframe.
Different indicator settings on every chart
An EMA 20 on one chart and an EMA 21 on another makes comparisons meaningless. Set indicators once and copy them.
No higher-timeframe chart
The level that stops a 5-minute move is usually on the daily chart. If you never look at it, you will keep buying into resistance.
Deciding on a small chart
Small charts hide wicks and exact prices. Expand the chart before you enter.
Watching instead of setting alerts
Staring at six charts for five hours wears out your attention by midday. Set alerts at your levels and look when they fire.
Treating a list as a signal
A stock appearing in a mover or scanner list is a reason to open its chart, not a reason to buy it.
Rebuilding the screen every day
Keep the layout fixed and change only the stocks. A familiar screen is read faster, and speed matters in the first hour.
What to keep next to your charts
Charts show price. A few other pieces of information make the charts easier to read.
| Information | What it adds | Watch out for |
|---|---|---|
| A list of candidates | Where your ideas come from, one click from a chart | A long list you never finish reading |
| Market breadth | Whether a rally is broad or carried by a few large stocks | Breadth can turn quickly in the first hour |
| Sector strength | Which group has the wind behind it today | A lone mover in a weak sector depends only on its own news |
| News and filings | Why a stock gapped or suddenly moved | News is often priced in within minutes |
| A trade journal | Whether your setup works over a month, not one day | Only logging winners |
How BreakPoint fits into this setup
The chart page puts the lists, the charts and the market context in one window. The lists below help you fill the bottom row. How each list picks its stocks stays private, and none of them is a buy or sell call.
The chart page itself
One, two, four or six live charts, the index capsules and market status in the top bar, and every list in one panel. The guide covers each control.
Filling the trade charts
Market Mover shows the day’s upside and downside movers. Load the ones that fit your setup into charts 4 to 6.
For F&O traders
OptionX lists F&O stocks on the move with their breakout or breakdown level. Open each one on a chart that already has your indicators.
The SMC Pro list
The SMC Pro list is picked by the SmartMoney model; the method stays private. Line the names up on your charts and judge each one on its own structure.
Ideas with levels
AlphaX ideas carry buy, target and stop levels, and a level that price has reached is highlighted in the list.
The multi-chart grid is a desktop feature. On a phone, the BreakPoint app has a chart and the same scanners, one stock at a time, so you can check an alert away from the desk.
Who should use this approach?
Intraday traders
Use the full six: index and sector on 5-minute, the main stock on daily, and three trade charts on 5-minute.
Swing traders
Shift everything one step up: index and trade charts on daily, the higher-timeframe chart on weekly. Most of the work happens after the close.
F&O traders
Put Nifty or Nifty Bank on chart 1 and fill the trade charts from F&O movers. Keep one chart on the daily timeframe for the index’s big levels.
Newer traders
Start with four charts and one indicator. Learning to read the index chart first is worth more than any extra chart.
Limitations and risks
- A better chart setup improves how quickly and calmly you read the market. It does not make any trade more likely to work.
- More charts can mean more trades. If your trade count goes up after moving to six charts, go back to four.
- Higher-timeframe levels are areas, not exact prices. Price often overshoots or stops short of them.
- Live charts and lists depend on your internet connection and the data feed. Always confirm prices with your broker before placing an order.
- Trading carries a risk of loss. Position sizing and stop-losses matter more than any screen layout.
Which BreakPoint plan fits the way you trade?
Pick by workflow, not by feature count. You can change plans later.
Breakpoint Pro
Breakpoint Pro opens the chart page in every layout, with the Market Mover list and the index capsules. Start with 28 days and move to 84 if it becomes your daily screen.
₹1,299 / 28 days · ₹3,299 / 84 days
Breakpoint Pro 365
Pro 365 adds the OptionX and AlphaX lists beside the charts, plus the F&O dashboard suite and Nifty 500 analytics.
₹7,999 / 180 days · ₹15,999 / 365 days
SMC Pro Indicator
SMC Pro gives the chart page with the SMC Pro and AlphaX lists and the SMC PRO indicators. The indicator also works on your own TradingView charts.
₹1,499 / 30 days (first month, once) · ₹4,449 / 90 days · ₹14,999 / 365 days
Still unsure? The 60-second product advisor asks four questions about how you trade and recommends one product. Prices as listed on the plans page; always confirm there before paying.
Frequently asked questions
Give each chart one job. Keep Nifty 50 and the stock’s sector index on your trading timeframe (usually 5 minute), keep the main stock on the daily chart for its big levels, and use the remaining charts for two or three stocks you might trade. Add two or three indicators you actually act on, such as EMA 20 and VWAP, and set alerts at your levels.
Four to six is enough for most traders, and at least two of them should be for context: the index and a higher timeframe. More trade charts than you can actually follow leads to late entries and extra trades.
Trade on one timeframe and check one step higher. Intraday traders usually trade the 5-minute or 15-minute chart and check the daily chart. Swing traders trade the daily chart and check the weekly chart. The higher timeframe is for levels and direction, not entries.
A simple plan: chart 1 Nifty 50, chart 2 the sector index, chart 3 your main stock on a higher timeframe, and charts 4 to 6 the stocks you might trade on your trading timeframe. Keep the layout the same every day and change only the stocks.
Two or three that answer a question you ask before every trade. Common choices are EMA 20 for trend and pullbacks, VWAP for intraday, volume for breakouts, and previous day high and low as levels. Set them up once and use the same settings on every chart.
Yes. BreakPoint’s built-in advanced charts use TradingView’s charting library, so the drawing tools, timeframes and shortcuts will feel familiar. BreakPoint adds Indian-market lists, index capsules and market breadth around the charts.
Yes. Keep the positions fixed (index, sector, higher timeframe on top, trade charts below) and change only the stocks. A familiar screen is read faster, and in the first hour of the session that speed matters more than a clever layout.
Not always. Your broker’s free charts are enough to learn and to trade a few stocks. A paid platform earns its cost when you want several live charts at once, stock lists next to them, and market context on the same screen, and when you use it every trading day.
Not usefully. Six charts need a laptop or monitor. On a phone, use one chart at a time and rely on alerts. BreakPoint’s multi-chart grid is a desktop feature, and the mobile app has its own single chart and the same scanners.
No. It helps you read the market faster and avoid trades that run into obvious levels. Profit depends on your setup, your stop-loss, your position size and your discipline.
Set up your six charts in five minutes
Open the chart page, choose 6 charts, put Nifty and your sector on top, and fill the bottom row from the Market Mover list.
BreakPoint tools open inside your account. If you are not signed in you will be asked to sign in first, and access depends on your active plan. The lessons and guides are free.
Scan the market from your phone — get the BreakPoint app
Keep learning
Terms used here: Watchlist · Market Breadth · Sector Rotation · Intraday Trading · Swing Trading · EMA (Exponential Moving Average) · VWAP (Volume Weighted Average Price) · Stop-Loss
This article is for education only. It is not investment advice or a recommendation to buy or sell any security. Trading involves risk of loss; examples are hypothetical and past behaviour of any pattern does not guarantee future results.