Chart Workspace: Up to Six Live NSE Charts, With the Market’s Best Lists Beside Them
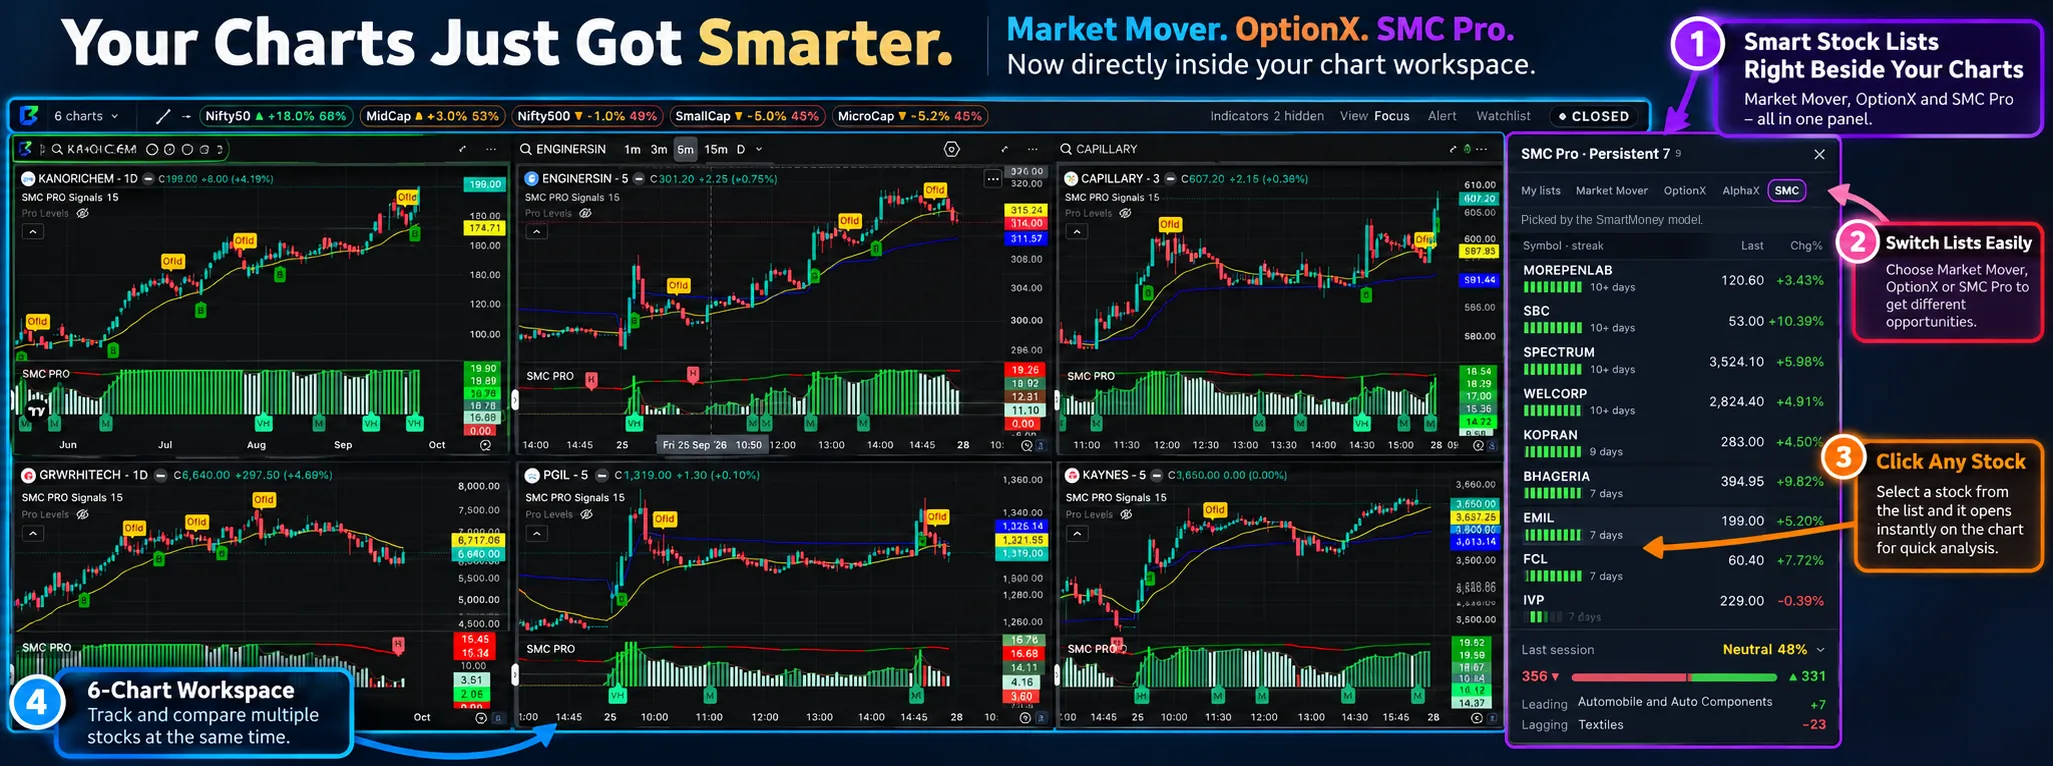
Watch one, two, four or six live charts at once, with Market Mover, OptionX and SMC Pro lists in a panel beside them — click a stock and it opens on the chart you picked.
Most traders run two screens: a list of stocks in one, charts in the other, and a lot of copying between them. The Chart Workspace puts the list, the charts and the market’s mood in one window.
The tool opens inside your BreakPoint account. If you are not signed in yet you will be asked to sign in first, and access depends on your active plan.
What is Chart Workspace?
The Chart Workspace is BreakPoint’s full-screen chart page, at brkpoint.in/chart. It opens one large chart, or splits the window into a grid of two, four or six live charts. Each chart has its own symbol and timeframe, so you can watch a stock on 5-minute and daily side by side, or six different stocks at once.
Beside the charts sits a list panel. Besides your own watchlists it carries BreakPoint’s live lists: Market Mover (the day’s upside and downside movers), OptionX (F&O stocks on the move), AlphaX ideas with their buy, target and stop levels, and the SMC Pro list. Click any stock and it opens on the chart you have selected. There is no copying, no second tab and no retyping tickers.
Above the charts, one bar shows the market’s state: the NSE status (pre-market, live or closed) and a strip of index capsules for Nifty 50, Nifty 500, midcap, smallcap and microcap, each with its move and advance ratio. The charts use TradingView’s charting library, so the drawing tools, timeframes and shortcuts behave the way you already know.
A stock appearing in a list is a reason to look at its chart, not a signal to buy it. The workspace makes that look fast. The decision is still yours.
Why use this tool?
A trade idea goes through four steps: finding the stock, reading its chart, checking the market around it and watching it. Usually they happen in four different places. This page does all four in one window.
Who it is for
Intraday traders
Keep four or six of today’s movers on screen at once and see which ones hold their levels, instead of flipping between tabs and missing the one that moved.
F&O traders
Put the OptionX list next to your charts and open each F&O mover on a chart that already has your indicators on it.
Swing traders
Watch the daily chart next to the 5-minute one for the same stock, or line up the SMC Pro list’s stocks one after another in the evening.
Newer traders
See the market’s direction, the leading indices and your chart in one view before deciding anything. That one habit saves many bad trades.
Key benefits
1, 2, 4 or 6 charts
Pick the layout from one dropdown. Each chart keeps its own symbol and timeframe, and any chart can be expanded to full size and put back with Esc.
Lists beside the charts
Market Mover, OptionX, AlphaX, SMC Pro and your own lists, in one panel. One click loads a stock into the chart you selected.
The market in one strip
Index capsules show how Nifty 50, Nifty 500, midcaps, smallcaps and microcaps are moving and how many of their stocks are up.
Indicators set up once
Add indicators to chart 1 and every other chart picks them up. The BreakPoint indicators come along too.
Your five favourite tools
Keep up to five drawing tools in the top bar, saved to your account. They draw on whichever chart is active.
Alerts from the chart
Right-click at a price to set an alert there, or set a range from the Alert panel. A log shows what fired and when.
Interface walkthrough
The page has three parts: the top bar, the chart grid and the list panel. Once you know what each part does, you can read the page in seconds.
- 1Top bar — Chart layout dropdown · favourite drawing tools · sector index capsules · Indicators · View · Alert · Watchlist · market status.
- 2Chart grid — One to six live charts. The active chart has a green outline: list clicks, drawing tools and alerts all act on it.
- 3List panel — Tabs: My lists · Market Mover · OptionX · AlphaX · SMC Pro. Click a row to load it into the active chart.
- 4Market today — At the foot of the list panel: how many stocks are advancing vs declining, and which industry leads and lags.
On mobile
The multi-chart grid is built for a desktop or laptop window at least 1,000 pixels wide. Narrower windows show one chart. On a phone, the BreakPoint app has its own chart, one stock at a time, alongside the same scanners.
How to use Chart Workspace
A routine that takes a couple of minutes at the open and keeps working all session.
Open /chart and pick a layout
Use the layout dropdown (after undo and redo on a single chart, or at the left of the top bar in a grid). Start with 4 charts. Six is great on a large monitor.
Read the top bar first
Check the market status and the index capsules. If midcaps and smallcaps are red while Nifty 50 is green, the rally is narrow, and your longs outside the big names need a higher bar.
Set up chart 1
Add the indicators you trade with on chart 1. The other charts copy them automatically, so you set up one chart instead of six.
Choose a list
Open the list panel and pick Market Mover, OptionX, AlphaX or SMC Pro. Use the Upside/Downside switch on the board tabs to see the side you trade.
Load stocks into charts
Click a chart to make it active (green outline), then click a stock in the list. Repeat for each chart. A small number next to a row tells you which chart it is already on.
Draw and set alerts
Pick a favourite drawing tool from the top bar and mark your level on the active chart. Right-click at a price to set an alert there.
Watch, then expand
When one chart starts doing something, expand it to full size, read it properly, then press Esc to go back to the grid.
Understanding every field
Every control on the page, and what to do with it.
| Field | What it tells you | How to use it |
|---|---|---|
| Chart layout | How many charts are on screen: 1, 2, 4 or 6. | Four for most screens. Six on a large monitor. One when you want to study a single chart closely. |
| Active chart | The chart with the green outline. | List clicks, drawing tools and alerts all go to it. Click another chart to make that one active. |
| Expand (⤢) | Makes one chart fill the whole grid. | Use it to read a chart in detail. Esc or “Back to N charts” returns to the grid. |
| View | Full, Compact or Focus, or Auto to let the layout decide. | Compact and Focus hide chart furniture so small charts show more candles. |
| Indicators menu | Shows or hides BreakPoint indicators and their dashboard cards on every chart at once. | Hide the dashboard cards when six charts feel crowded; the indicators keep drawing. |
| Favourite drawing tools | Up to five drawing tools of your choice in the top bar. | The pencil button chooses them. They are saved to your account and draw on the active chart. |
| Index capsules | Nifty 50, Nifty 500, midcap, smallcap and microcap: each index’s move and the share of its stocks that are up. | Check whether a move is broad or carried by a few large stocks before you trust it. |
| Market status | Pre-market, live or closed, for NSE. | A quick check that you are reading live prices and not the last session’s. |
| Market Mover tab | The Market Mover page’s live upside and downside boards. A yellow asterisk marks a stock that was on the same side yesterday, and a small time under the ticker shows when it first joined today’s board. | Early joiners that are still on the board later in the day are worth a chart look; a name that just arrived may already be stretched. |
| OptionX tab | F&O stocks moving up (Movers) or down (Draggers), with the breakout or breakdown level, gap and trend. | “Trend aligned” keeps only stocks whose move agrees with their trend. |
| AlphaX tab | Your AlphaX ideas with buy, target and stop levels. | A level that price has already reached is highlighted, so you can see which ideas have done something. |
| SMC Pro tab | The SMC Pro list, picked by the SmartMoney model. The method stays private. | Line the names up on your charts and judge each one on its own chart structure. |
| Market today | Advancing vs declining stocks and a one-word verdict, plus the leading and lagging industry. | Size your trades with it: the same setup deserves less money in a weak market. |
How the Chart Workspace compares with other charts
Most Indian traders already use at least one of these. Here is what each is built around, so you can see where the workspace fits alongside them.
| What you need | BreakPoint Chart Workspace | Global charting platforms (e.g. TradingView) | Broker trading terminals (e.g. Kite, Upstox, Dhan) | Screener websites (e.g. Chartink) |
|---|---|---|---|---|
| Several charts in one window | 1, 2, 4 or 6 live charts, each with its own symbol and timeframe | Core feature; how many charts per layout depends on the subscription | Varies by broker; built first around placing orders | Results list; charts open one at a time |
| Where your stock ideas come from | Live lists built for Indian traders (Market Mover, OptionX, AlphaX, SMC Pro) inside the chart page | Watchlists you build; screeners on a separate screen | Watchlists you build; market lists usually on a separate screen | Scans you write yourself |
| From list to chart | One click loads the stock into the chart you selected | One click from your watchlist | One click from your watchlist | Opens a chart per result |
| Indian market context on the same screen | Index capsules with advance ratios, market breadth, leading and lagging industry, NSE status | Global coverage; Indian breadth views are something you add | Index quotes; breadth views vary | Not its focus |
| BreakPoint indicators | SMC PRO, SMC PRO Chart Signals and Pro Levels (by plan), set once and copied to every chart | Very large community library; the SMC Pro indicator is also available there with the SMC Pro plan | Standard indicator set | Not applicable |
| Price alerts | Right-click at a price or set a range, with a log of what fired | Core feature | Offered by most brokers | Scan-based alerts |
| Placing orders | Not a broker: plan the trade here and place it with your broker | Through connected brokers | The core of the product | Not its focus |
Other platforms change their features and prices often. This table describes what each is built around, not a feature audit. Check the details with each provider.
For the wider picture across scanners, research and charting platforms, see the stock scanner comparison.
A worked example
A hypothetical first hour with four charts
Hypothetical example. It is 9:40 am. The market status reads Live. The index capsules show Nifty 50 and Nifty 500 green, midcaps green with most of their stocks up, and microcaps red. You open the Market Mover tab on the Upside side, with four charts on screen.
How to read it
The capsules say the strength is in large and mid-sized stocks, not the smallest names. So you load three midcap movers that joined the board early into charts 1 to 3, and put the daily chart of the strongest one in chart 4 for context. Your indicators are already on all four because chart 1 carries them. Two of the three have pulled back to the level they broke. You mark those levels with the horizontal line from the top bar and right-click to set an alert just above each one.
The workspace did not choose the trade. It cut the time between noticing a stock and reading its chart to one click, so you spent the first hour judging setups instead of switching tabs.
Best practices
Getting the most out of the Chart Workspace comes down to a few habits.
✅ Do this
- Read the market status and index capsules before any single chart.
- Set up indicators once, on chart 1, and let the grid copy them.
- Keep one chart on a higher timeframe (daily) of your main stock, for context.
- Click the chart you want first, so the stock lands where you expect.
- Expand a chart before making a decision on it. Small charts are for watching.
- Mark your stop-loss level on the chart before placing the order with your broker.
⛔ Avoid this
- Do not fill six charts with six stocks you will not have time to watch.
- Do not treat a stock appearing in a list as a buy signal.
- Do not trade against the capsules all day. When most indices are red, longs need a stronger reason.
- Do not rely on small-chart candles for exact entry prices; expand first.
More charts is not more edge. Four stocks you actually watch beat six you only glance at. Use the extra charts for context, like a higher timeframe of the same stock, not for more trades.
Which plan opens what — and the mobile app
The charts, the 1/2/4/6 layouts, drawing tools, alerts and your own lists come with any paid plan. The list tabs follow the plan of the page they come from.
Breakpoint Pro
₹1,299 / 28 days · ₹3,299 / 84 days
The chart workspace in every layout, plus the Market Mover tab and the sector index capsules.
See Breakpoint Pro →Breakpoint Pro 365
₹7,999 / 180 days · ₹15,999 / 365 days
Everything in Pro, plus the OptionX and AlphaX tabs, for F&O and full-time traders.
See Pro 365 →SMC Pro Indicator
₹1,499 / 30 days (first month, once) · ₹4,449 / 90 days · ₹14,999 / 365 days
The chart workspace with the SMC Pro and AlphaX tabs and the SMC PRO indicators. The indicator also works on your TradingView charts.
See SMC Pro →Prices are per cycle as listed on the plans page. Access follows your active plan.
Take BreakPoint with you
The BreakPoint app for Android and iPhone carries the scanners and a chart on your phone. The multi-chart grid is a desktop feature.
Frequently asked questions
One, two, four or six, chosen from the layout dropdown. Each chart has its own symbol and timeframe. The grid needs a browser window at least 1,000 pixels wide; narrower windows show one chart.
Open a multi-chart layout, load one stock into each chart, and keep a list of candidates beside the charts. On BreakPoint, pick 4 charts on /chart, click a chart to make it active, then click a stock in the Market Mover or OptionX list to load it there.
It uses TradingView’s charting library, so the charts, drawing tools and shortcuts will feel familiar. What it adds is Indian-market context around the charts: live Market Mover, OptionX, AlphaX and SMC Pro lists beside them, and NSE index capsules above them. Many traders use both. TradingView for global markets and community scripts, BreakPoint for NSE lists and context.
Yes, alongside them. BreakPoint does not place orders. You find and read the setup here and place the order with whichever broker you use.
Yes. Indicators you add to chart 1 are copied to every other chart in the grid, so you set them up once. If you change a setting on one of the other charts, that chart keeps your change.
Chart 1’s layout, including indicators, drawings and timeframe, saves to your BreakPoint account, and so do your favourite drawing tools. The other charts remember their stocks on the computer you set them up on.
How Nifty 50, Nifty 500, midcap, smallcap and microcap stocks are moving today, and what share of each index’s stocks are advancing. They are sorted by strength, so the strongest part of the market is always first.
It marks the active chart. Stocks you click in the list, drawing tools from the top bar and new alerts all go to that chart. Click another chart to make it active.
Yes. Right-click on the chart at a price and choose to add an alert there, or open the Alert panel to set a range. A log shows which alerts fired and when.
The multi-chart grid is a desktop feature. On your phone, the BreakPoint app for Android and iPhone has a chart and the same scanners, one stock at a time.
Any paid plan opens the charts and layouts. Breakpoint Pro adds the Market Mover tab and index capsules. Pro 365 adds OptionX and AlphaX. SMC Pro adds the SMC Pro list and indicators. The plans page has current prices.
Yes. brkpoint.in/chart and brkpoint.in/chartview open the same workspace, so old bookmarks keep working.
Jargon used on this page, explained
Every technical term above, written for someone who has never traded before.
Watchlist
A short, curated list of stocks you are actually tracking.
A scanner produces candidates; a watchlist is what you commit to watching tomorrow morning. Keeping it short is the point. Most traders can meaningfully follow five to fifteen names, and a bloated watchlist quietly turns into no watchlist at all.
Market Breadth
How many stocks are participating, not just the index.
An index can rise because five heavyweight stocks rose while three hundred fell. Breadth counts advancers against decliners to reveal whether a move is broad or narrow. Broad participation supports a trend; a narrowing market is a warning even when the headline number looks healthy.
Sector Rotation
Money moving from one part of the market to another.
Capital rarely leaves the market entirely — it moves. When banks cool off and metals begin to lead, that is rotation. Spotting it early puts you in the group of stocks with a tailwind instead of fighting a sector that has just lost its sponsorship.
Momentum
The tendency of strong stocks to keep being strong.
Momentum is the observation that recent winners tend to keep outperforming for a while. It is the engine behind most scanners: instead of hunting for hidden value, you sort the market by what is already working and look for the cleanest way to join it.
Intraday Trading
Positions opened and closed inside the same session.
Intraday trading avoids overnight news risk but demands speed and discipline, because every decision has to happen while the market is moving. Costs matter more here than anywhere else — commission and spread are paid on every round trip.
F&O (Futures & Options)
Contracts whose value is derived from an underlying asset.
Futures commit you to a price on a future date; options give the right, not the obligation, to transact at a price. Both are leveraged, meaning small deposits control large exposure — which magnifies mistakes as efficiently as it magnifies good decisions.
Smart Money
The large, well-informed participants — funds and institutions.
Smart money is shorthand for participants who trade size: mutual funds, insurance companies, foreign institutions, proprietary desks. They cannot buy in one click without moving the price, so they accumulate quietly over days. That footprint — steady buying, unusual delivery, price defended at the same zone repeatedly — is what smart-money tools try to detect.
Stop-Loss
The price at which you accept the idea was wrong.
A stop-loss is decided before entry, not after. Its job is not to be right, it is to keep any single loss small enough that the next twenty trades still matter. Placing it under a structural level — a support zone, the low of the breakout candle — is more useful than a round percentage.
Looking for a term that is not here? The full trading glossary covers every concept used across these guides.